
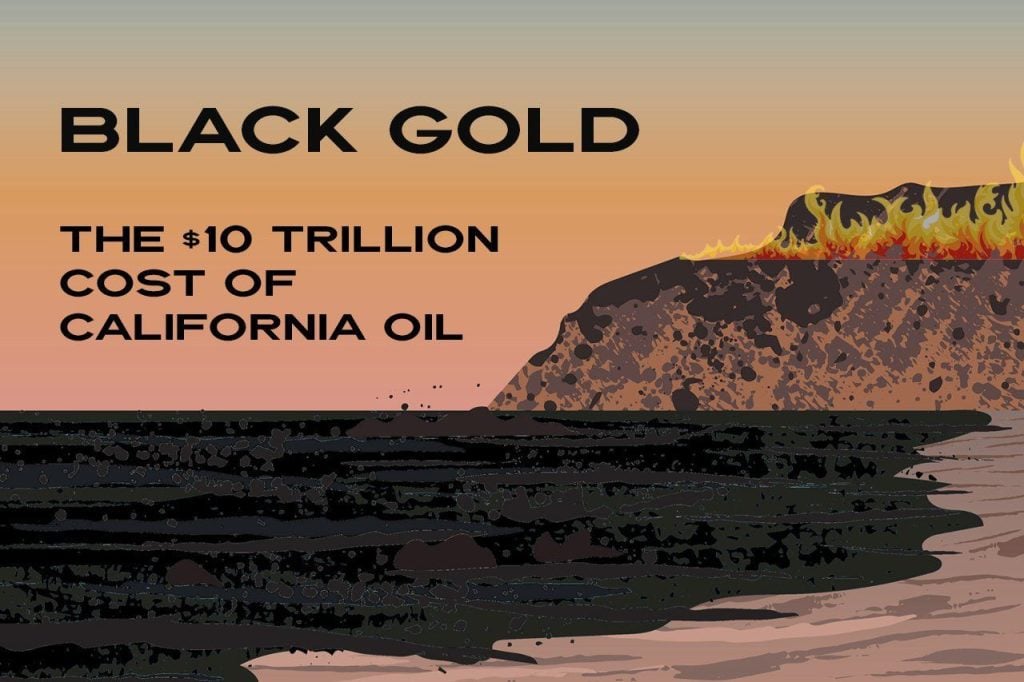
Introduction “The true cost of California’s oil and gas is staggering and unsustainable.”
According to the oil industry, California oil and gas production is indispensable. But a rough tally of costs in the form of harm to public health from oil and gas pollution, fossil fuel-accelerated global warming, exacerbated wildfires and drought, and fiscal risk to taxpayers, shows that the true cost of California’s oil and gas is staggering and unsustainable.
This report is based on a review and application of published sources, including state, nonprofit advocacy, and scientific studies estimating the economic costs of greenhouse gases resulting mainly from the combustion of fossil fuels and of the effects of their toxic emissions on public health.
A rough estimate calculates more than $400 billion in annual costs through 2045 when California aims to be carbon neutral with a total price tag of $10 trillion. Such costs are very difficult to quantify and this report is meant solely as a starting point for discussion of the true public costs of oil and gas on California. Here are how the costs break down through 2045: Fossil Fuel EffectAnnual Costs Wildfires and Drought$94.2 Billion Heat-Related Deaths From CA Oil $1.4 Billion Wells Air Pollution$339 Billion Total Annual Cost$434.6 Billion Cumulative Cost thru 2045 (23 $10.0 Trillion YRs)
| Fossil Fuel Effect | Annual Costs |
|---|---|
| Wildfires and Drought | $94.2 Billion |
| Heat-Related Deaths From CA Oil Wells | $1.4 Billion |
| Air Pollution | $339 Billion |
| Total Annual Cost | $434.6 Billion |
| Cumulative Cost thru 2045 (23 YRs) | $10.0 Trillion |
Global Warming, Wildfires And Drought
A meteoric rise in global carbon emissions has happened in a split second of geologic time. Global carbon emissions have increased by about 90% since 1970. “The burning of fossil fuels is the primary cause of current climate change, altering the Earth’s ecosystems and causing human and environmental health problems,”1 according to the University of California Berkeley. Today, the US EPA estimates that fossil fuel combustion and industrial emissions contribute about 78% to that2 total greenhouse gas emissions increase. The effects on the climate, environment, and public health are profound.
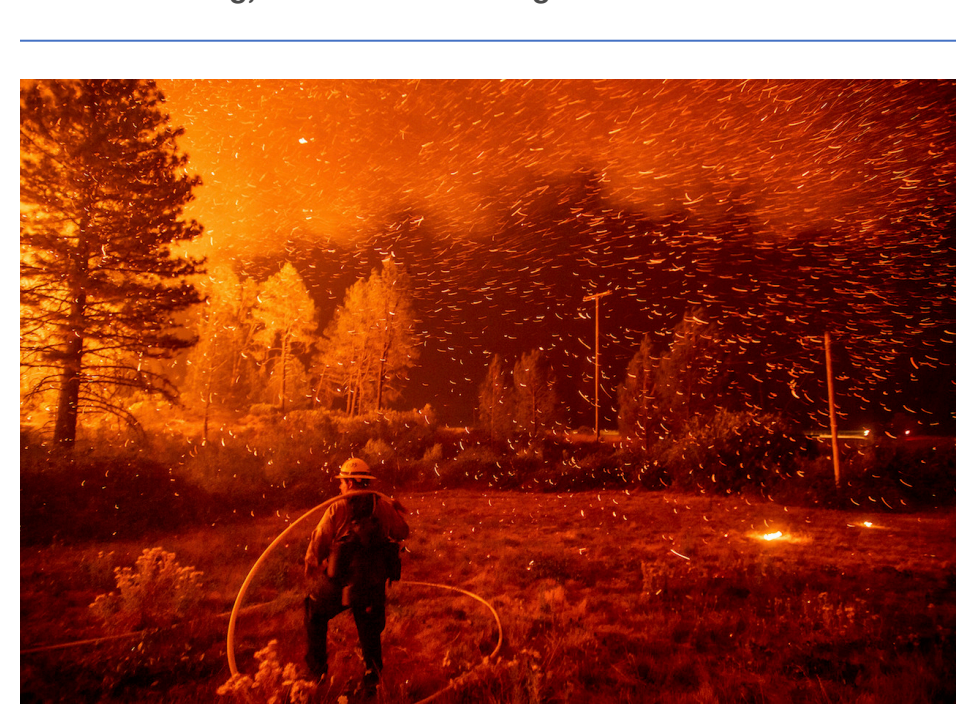
California is the second largest emitter of greenhouse gases among U.S. states after3 Texas, the largest domestic oil producer in the United States.According to the California Air Resources Board (CARB), 85% of California’s own greenhouse gas emissions in 2019 came from the burning of fossil fuels. Transportation, including heavy duty vehicles, accounted for 40% of those emissions, electrical generation 14%, and industrial emissions—including from refineries—21%. Residential and4 commercial sources contributed more than 10%. California alone contributes about one percent of all global greenhouse gas emissions, while the United States is5 the second largest contributor among countries, responsible for almost 14%. These global emissions are helping to exacerbate the severity, duration, and intensity of California wildfires as well as the severity of the state’s megadrought. The West’s now 20-year megadrought is the worst in 1,200 years, according to scientists. According to CalFire, 18 of the 20 worst wildfires in California have6 occurred this century and 14 of them took place in just the last decade. Wildfires are currently becoming a year-round problem. In addition, a new study shows that wildfires are increasingly able to survive nights when temperature typically dips and7 humidity increases.
When it comes to wildfires, global warming is 70% to 88% responsible for the atmospheric conditions driving extreme wildfires in the West, according to a study8 by scientists at UCLA and Lawrence Livermore National Laboratory. Assuming a direct correlation between wildfire extent and costs, an average of about 80%—or virtually four fifths of One third of the the costs—could be attributable to climate change.
Since fossil fuel combustion specifically is
costs of drought can
responsible for 78% of that climate change, about 62% of wildfire costs are due to the exacerbation of
be attributed to
climate change via the combustion of fossil fuels.
greenhouse gas
Scientists also estimate that human-caused global warming has intensified drought. A 2022 study
emissions caused by
estimates that climate trends caused by human activity have accounted for about 42% of the
the combustion of
average soil moisture deficit between 2000 and10
fossil fuels.
2021—which worsens drought.
Drought directly affects crop yields by constraining water resources. Lack of water causes land fallowing, crop yield drops and failures, and increased costs for buying, pumping, and delivering water. In addition, climate11 change disrupts precipitation patterns, affecting crops. Assuming a direct correlation between average moisture deficit and economic costs, 42% of the costs of drought could be attributed largely to greenhouse gas emissions—78% of them from fossil fuel combustion. So, about one third of the costs of drought can be attributed to greenhouse gas emissions caused by the combustion of fossil fuels.
Counting All The Costs
According to the National Centers for Environmental Information (NCEI), over the last decade wildfires have cost the state between $50 billion and $100 billion in direct costs such as fire suppression, insured property losses, damage to utility lines12 and evacuations. Drought has cost California between $10 billion and $20 billion in direct costs—meaning $1 billion to $2 billion annually in reduced crop yields, livestock losses, and pond depletion. Extreme weather events such as flooding and severe storms and their attendant destruction have cost between $2 billion and $5 billion over a decade, according to NCEI.
Going forward, a new report from NASA, NOAA and other agencies states that sea levels will rise by as much as one foot by 2050 and as much as eight inches on the West Coast. This will subject California coastal areas to frequent floods and degraded infrastructure. Flooding from one foot of sea level rise risks $15 billion13 worth of California properties affecting 38,000 people. Groundwater pushed up by rising seas risks $100 billion worth of additional properties where 350,000 people live. Rising seas threaten all infrastructure such as roads, water supplies, power plants, oil and gas wells, sewage treatment systems and nearly “everything that we use, eat and wear” that comes through the supply chain and arrives at coastal ports, according to a top NOAA official quoted by the Los Angeles Times. The cost of wildfires is typically measured in buildings destroyed, lives lost, and acres burned, according to the National Fire Protection Association. “There are also less quantifiable metrics that may be even more costly: disruptions to businesses and supply chains, taxes, and tourism; residents left with soaring medical14 bills; and polluted air, soil, and waterways.” These are the typical indirect costs15 left out of calculations. For example, drought and lack of moisture can lead to poor soil quality so the soil produces smaller crops. That can drive up food prices. The indirect costs of wildfires include the impacts of smoke inhalation on health or post-fire water quality, lost tourism and tax revenue, supply chain disruptions,
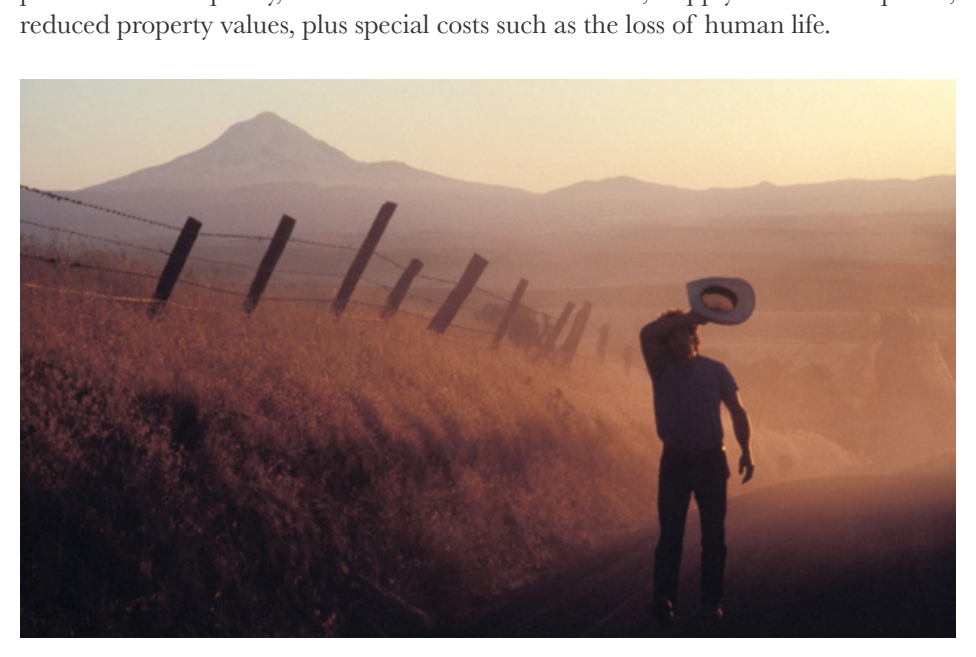
reduced property values, plus special costs such as the loss of human life. California has not produced a comprehensive calculation of wildfire costs because state agencies do not calculate indirect costs such as the health impacts of wildfires, according to a 2020 report by the California Council on Science & Technology16 (CCST). Costs associated with such unquantified categories of loss “may likely exceed” the direct costs, such as insured property losses and firefighting costs, that are typically reported:
The cost of wildfires is typically measured in buildings destroyed, lives lost, and acres burned, according to the National Fire Protection Association. “There are also less quantifiable metrics that may be even more costly: disruptions to businesses and supply chains, taxes, and tourism; residents left with soaring medical bills; and polluted air, soil, and waterways.”14 These are the typical indirect costs left out of calculations. 15 For example, drought and lack of moisture can lead to poor soil quality so the soil produces smaller crops. That can drive up food prices. The indirect costs of wildfires include the impacts of smoke inhalation on health or post-fire water quality, lost tourism and tax revenue, supply chain disruptions, reduced property values, plus special costs such as the loss of human life.
For example, federal and State firefighting expenditures exceed $3 billion per year; utility wildfire prevention and mitigation costs are approximately $5 billion per year; whereas the insured property losses in three out of the past four years have exceeded $10 billion per year,” the CCST report stated. “Evidence suggests health impacts due to wildfire smoke represent a substantial portion of the total costs to the State, and that there are impacts from the interaction of wildfire smoke and COVID-19. Yet these additional billions of dollars in costs due to wildfire smoke impacts are not consistently tracked or factored into policy planning. AccuWeather counts direct and indirect costs. Its estimates tally damage to homes and businesses as well as their contents and cars, job and wage losses, farm and crop losses, infrastructure damage, auxiliary business losses, school closures and the costs of power outages to businesses and individuals. Accuweather also factors in economic losses from highway closures, evacuations and increased insurance premiums throughout the state, firefighting costs, flight cancellations and delays and the current and long-term residual health effects on those impacted by dirty air. People at the greatest risk from wildfires include those who have heart or lung diseases, according to the Centers for Disease Control and Prevention. When calculating only direct costs, such as insured property losses and firefighting costs, wildfires can tally up to $10 billion per fire. But factoring in indirect costs, such fires can end up costing many times more. Accuweather estimated that California wildfires cost the state $85 billion in 2017 and $400 billion in 2018 due17 to the magnitude of the fires.
That year, the Camp Fire that destroyed more than 18,000 structures became California’s deadliest and most destructive wildfire ever recorded. Accuweather’s 2018 calculation included property damage, firefighting costs, direct and indirect losses and recovery spending. A series of wildfires struck the state, mostly in the Northern half, and in August, a national disaster was declared. That year, California experienced a number of catastrophic fires including the Carr Fire, the Mendocino Complex Fire, the Ranch Fire, and the August Complex Fire. In November 2018, the state was hit with strong winds that fanned another batch of wildfires, including the Woolsey Fire and the Camp Fire. Among other factors, the 2018 wildfire season was stoked by an increase in dead tree fuel. California tallied a record 129 million dead trees by the end of 2017—linked to severe drought that dried deep root systems.
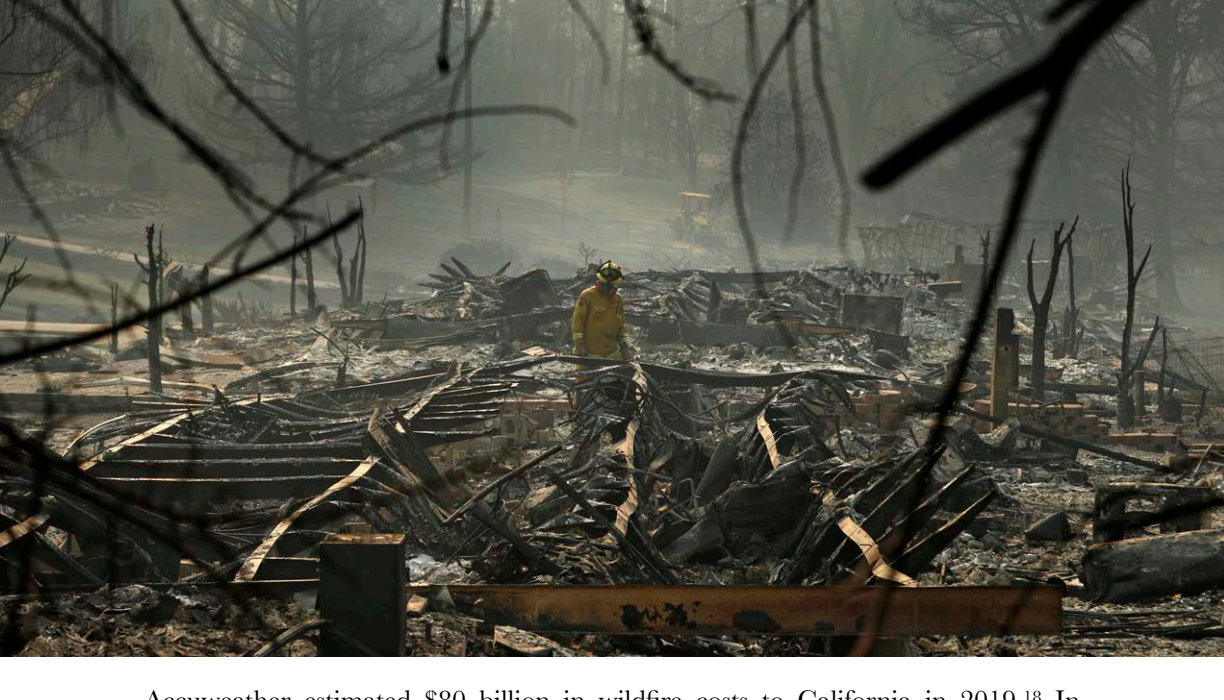
Accuweather estimated $80 billion in wildfire costs to California in 2019. In September 2020, it estimated that year’s fire season’s costs could reach between19 $130 billion and $150 billion.
AccuWeather estimates that the 2021 wildfire season will have cost between $45 and $55 billion in total damages and cumulative losses to California out of between20 $70 to $90 billion from wildfires throughout the West.
If we average Accuweather numbers over five years, going forward Californians will be paying roughly $151 billion annually for wildfires.
Conservatively, if we ascribe 62% of the costs of wildfires to greenhouse gas emissions from fossil fuels, that comes to $93.6 billion a year. Further, if we ascribe one third of the costs of drought alone to the same factor, and drought is costing California between $1 billion and $2 billion dollars a year, then the cost to California comes to $333 million to $666 million annually.
Cost to California for fossil fuel-exacerbated wildfires and drought: $94.26 billion annually for a total of $2.16 Trillion through 2045
Cost Of Heat-Related Deaths From California Wells
Looking at the effects more broadly of oil and gas’s contribution to climate change, the Newsom Administration’s approval of thousands of new oil and gas wells since he took office in 2019 will stoke heat-related deaths, according to the Center for Biological Diversity (CBD). According to the US EPA, when people are exposed to extreme heat, they potentially face deadly illnesses such as heat exhaustion and heat stroke. Hot temperatures can also contribute to deaths from heart attacks, strokes,21 and other forms of cardiovascular disease.
The CBD looked at permits for 4,240 new wells approved under Gov. Newsom for which data was available and concluded that over their lifespans these wells will produce an estimated 144 million metric tons of carbon dioxide pollution—the22 equivalent of an extra 31 million cars on the road for a year. “Based on a recent estimate of the heat-related deaths caused by each metric ton of carbon dioxide, the wells approved by the Newsom administration could cause as many as 97,500 excess heat-related deaths worldwide by 2100,” CBD wrote. The nonprofit used an estimate of the number of deaths caused by one additional ton of carbon dioxide,
According to the US EPA, when people are exposed to extreme heat, they potentially face deadly illnesses such as heat exhaustion and heat stroke. Hot temperatures can also contribute to deaths from heart attacks, strokes, and other forms of cardiovascular disease.21
Based on a recent estimate of the heat-related deaths caused by each metric ton of carbon dioxide, the wells approved by the Newsom administration could cause as many as 97,500 excess heat-related deaths worldwide by 2100,” CBD wrote. The nonprofit used an estimate of the number of deaths caused by one additional ton of carbon dioxide,
known as the mortality cost of carbon—developed at Columbia University—to arrive at its conclusions.
The federal government prices carbon according to its social cost—a measure, in dollars, of how much economic damage results from emitting one ton of carbon dioxide into the atmosphere. For example, when a power plant burns coal or natural gas, that releases greenhouse gases leading to economic damage that23 society, not the power plant, pays for. Instead, taxpayers shell out billions of dollars annually to fight climate change—from extinguishing wildfires to building flood protection to facing rising insurance costs. This cost to society is not included in the price consumers pay for fossil fuels or
Taxpayers shell out
agricultural or other products made by industries generating greenhouse gases. To arrive at the
billions of dollars
social cost, economists use future projections for the growth of the population, emissions, and climate change. Various models deliver a range of annually to fight possible costs.
climate change—
Until now, economists who calculated the cost of carbon did not factor in one of the biggest
from extinguishing
measures of damage caused by climate change—
wildfires to building
climate-related deaths. For example, the Biden Administration uses the still tentative figure of $51
flood protection to
per metric ton of carbon—without that factor.
“Summer 2021’s record-shattering temperatures,
facing rising
which led to hundreds of deaths in the Pacific Northwest and Canada, made it painfully obvious
insurance costs.
that climate change isn’t a far-off threat — it’s25 already killing people,” according to Vox. “So, you might think that the SCC [Social Cost of Carbon] would also include a decent estimate as to the number of climate-related deaths per ton. But due to a lack of reliable data, it didn’t. There was no centralized data source enabling scientists to access daily temperature-related mortality figures for each country, so deaths barely factored into the calculation.”
Danny Bressler, a PhD candidate in sustainable development at Columbia University, first calculated how many additional metric tons of carbon dioxide will cause one excess death globally between 2020 and 2100. In his formula, he used the Value of a Statistical Life (VSL). Human lives do not carry a price tag. But various federal agencies use different numbers to calculate a VSL. The US EPA uses a figure of about $10 million. The VSL estimate used reflects “how much individuals are willing to pay for a very small reduction in the probability of death,26 paid for by forgoing the consumption of other goods and services.”
Bressler then factored that cost into calculating the overall social cost of carbon. That quintupled carbon’s social cost per ton of emissions used by the Biden27 Administration. Incorporating mortality costs increased the social cost of carbon in 2020 from $37 to $258 per metric ton as a central estimate, with other estimates as high as $789 per metric ton. That means incorporating mortality costs increased the social cost of carbon by $221 or $752 per metric ton, respectively. Bressler’s paper used various VSL estimates to arrive at that spread in cost.
The CBD used Bressler’s mortality cost formula together with an estimate of emissions over the life of a sample of California wells for which data was available and concluded that the cost of carbon emissions by 2100 will be at almost $32 billion and could reach as high as $108 billion. The latter number comes nearly $1.4 billion annually between now and the end of the century. The cost will total $32 billion by 2045, on the way to $108 billion by 2100.
Cost of Excess Heat-Related Deaths From California Wells: $1.4 billion annually for a total of $32 billion through 2045
Human lives do not carry a price tag. But various federal agencies use different numbers to calculate a VSL. The US EPA uses a figure of about $10 million. The VSL estimate used reflects “how much individuals are willing to pay for a very small reduction in the probability of death, paid for by forgoing the consumption of other goods and services.”26
Air Pollution Health Costs From Combustion of Fossil Fuels
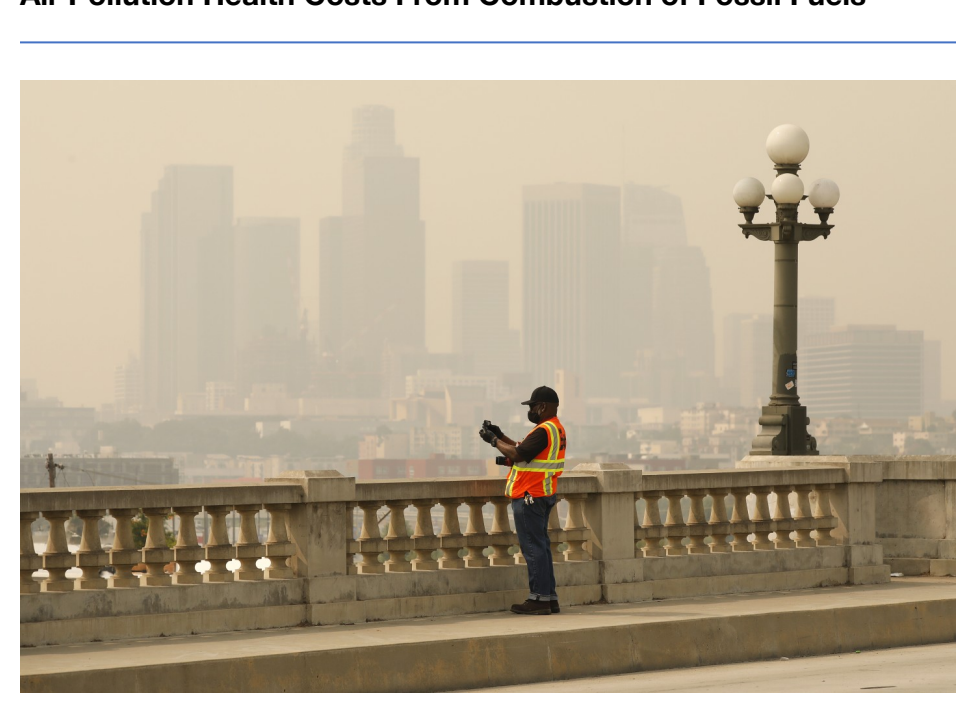
The production, refining, and combustion of oil and gas products is a major28 detriment to public health. California cities consistently top the list for the most polluted air in the United States.
In 2021, the American Lung Association found that, “Los Angeles remains the city with the worst ozone pollution in the nation, as it has for all but one of the 22 years tracked by the ‘State of the Air’ report… And Bakersfield, California returned to the most polluted slot for year-round particle pollution for the second year in a29 row.”
In its 2022 State of the Air report, the American Lung Association found a sharp uptick in air pollution nationwide over the past five years, including for fine30 particulate matter and ozone. But the worst areas for short-term particle pollution are largely concentrated in California: the Fresno-Madera-Hanford area, Bakersfield, San-Jose-San Francisco-Oakland and Redding-Red Bluff where more than 62 million people live. For ozone pollution, the five worst cities in the nation are Los Angeles-Long Beach, Bakersfield, Visalia and the Fresno-Madera-Hanford
Los Angeles remains the city with the worst ozone pollution in the nation, as it has for all but one of the 22 years tracked by the ‘State of the Air’ report… And Bakersfield, California returned to the most polluted slot for year-round particle pollution for the second year in a row.”29
regions. Out of 58 counties, 32 got Fs for high ozone days, and 44 got Fs for31 particulate matter pollution.
According to the United Health Foundation’s U.S. health rankings, California is the least-healthy of all states due to air pollution from particulate matter of 2.5 microns32 or less. Populations most affected by breathing in PM2.5 generated by cars, trucks and buses in California are people of color. These toxic particles are 30 times narrower than the width of a human hair and lodge deep in the lungs.
According to Physicians for Social Responsibility Los Angeles (PSR-LA), air pollution kills more people in Southern California alone than in any other air basin in the United States. “In particular, air pollution in the form of ozone and particulate matter, which comes almost exclusively from the use of fossil fuels,33 causes health problems at rates that are staggering.” To put deaths from exposure to PM2.5 alone into perspective, those deaths are more than double the number of motor vehicle-related deaths, PSR-LA stated.
“In the South Coast Air Basin alone, the cost of air pollution is more than $1,250 per person per year,” PSR-LA wrote. “This translates to a total of nearly $22 billion in costs per year that could be avoided if federal ozone and PM2.5 standards were met.” Rolled into this estimate are millions of days of school absences and restricted activity, hundreds of thousands of lost workdays, and thousands of respiratory and cardio hospital admissions from both ozone-related and PM2.5-related adverse health effects in California’s biggest counties. These costs were drawn from a 2008 study by two economists at Cal State Fullerton that focused on the South Coast and San Joaquin Valley air basins. The San Joaquin Valley’s contribution in air pollution costs came to more than $1,600 per person, or $6 billion to the region’s economy annually. The total economic cost of air pollution between the South Coast and San Joaquin Air Basin came to $2834 billion annually.
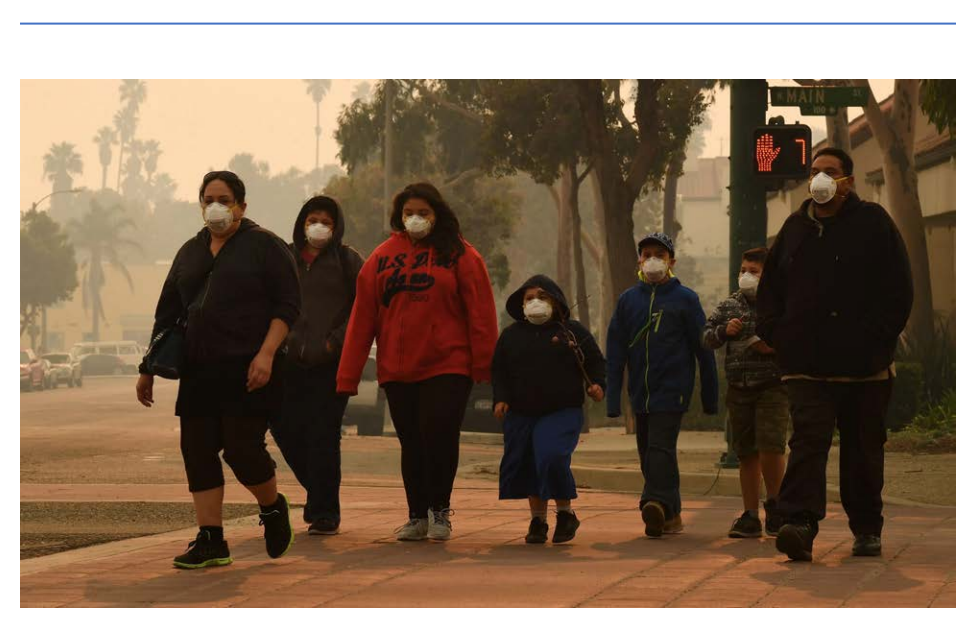
In 2020, costs had jumped. Los Angeles alone had the greatest per capita air pollution cost in the world in 2020, at $2,700 per person, according to IQAir.com,35 which operates the world’s largest free real-time air quality information platform. This pollution cost Los Angeles $32 billion in economic losses. Economic consequences include reduced work hours and shifts, increased healthcare costs from disability, asthma, and chronic respiratory disease and lost household income from caregiving for sick family members.
These statistics are still an improvement over impacts in 1973-1975—before regulation of auto emissions, according to CARB. CARB estimates that today California experiences 33,600 fewer premature deaths annually due to PM2.5. Regulation of PM2.5 and ozone since the 1960s has saved the state $250 billion in36 the economic value of health benefits, according to a 2018 CARB assessment. Despite the doubling of population and quadrupling of vehicle use, pollutant levels fell 75% to 99% in all communities and California avoided nearly 30,000 premature deaths a year in the last half century.
Nevertheless, a 2019 study of air pollution in the form of PM2.5 and ozone produced by a team of scientists including from UCLA, Princeton University and the California Institute of Technology estimated based on 2012 data that37 associated annual mortality in California ranged from 12,700 to 26,700 deaths. More than half of those deaths were attributable to in-state man-made emissions. Based on epidemiological evidence, they estimated that ozone could be associated with up to 13,700 deaths from respiratory and cardiovascular disease in California. In addition, three quarters of the ambient ozone in California was due to distant emissions outside the Western United States that were associated with 92% of the ozone-associated mortality.
The team estimated the monetized health losses in California due to PM2.5 and ozone exposures at $224 billion and $115 billion, respectively, on an annual basis. Cost of California Health Losses from Exposure to PM2.5 and Ozone: $339 billion annually for a total of $7.8 Trillion through 2045
Public Health Damage To Environmental Justice Communities From California Oil Wells
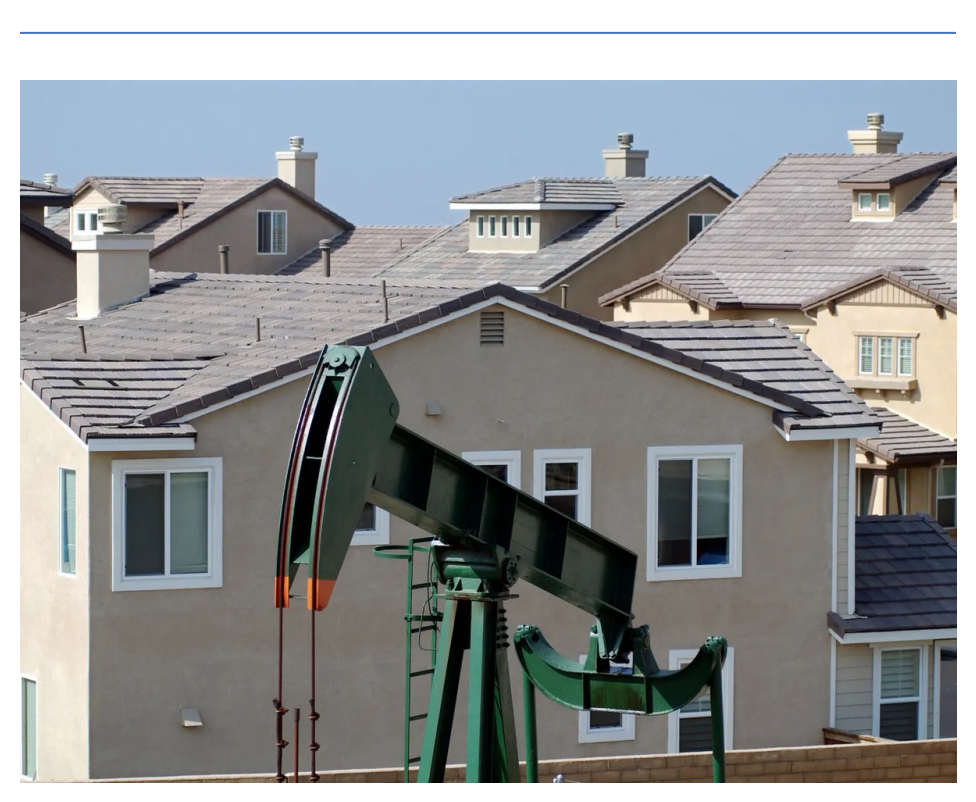
A subset of air pollution costs are the health impacts that environmental justice communities composed mainly of economically disadvantaged people of color absorb at greater rates than the rest of society. These are the communities that most often live near major freeways and next to sources of pollution from lead battery recycling plants to oil drilling and pesticide sprayed agricultural fields. More of the costs of pollution falls on these communities than on anyone else. Oil extraction in California in particular goes on primarily in environmental justice communities. Some seven million Californians live within a mile of a well, and two million within half a mile. Adverse health impacts on those living within 2,500 feet of wells range from increased acute diseases such as asthma and increased incidence and severity of COVID-19 to chronic diseases including cancer and reduced cardiopulmonary function. Proximity to oil operations can also lead to poor birth outcomes and long-term consequences on life expectancy, according to a memo submitted to state oil regulators at the California Geologic Energy Management Division (CalGEM) on the benefits of a buffer zone between extraction activities and nearby communities prepared by academics from UC Berkeley, Stanford, the University of Southern California, Occidental College, and38 other experts.
“Social and economic costsof health deterioration resulting from exposure to toxic emissions for extraction activities include costs related to morbidity, such as increased health services, productivity losses from disease and absenteeism, long term care for low birth weight or preterm birth, and mortality…,” the memo39 states.
Authors of the memo to CalGEM calculated solely on the basis of a reduction in inhalation exposure to fine particulate matter of 2.5 microns in diameter that if people were moved at least 2,500 feet away from oil operations, then 4.5 premature deaths would be averted annually per 100,000 people. “With a Value of a Statistical Life of $10,000,000 estimated by the EPA in 2019, then averting 4.5 deaths leads to a social benefit of $45M annually,” the researchers calculated. The VSL, or value of a statistical life, is an estimate of the amount of money that large groups of people are willing to pay for small reductions in their risks of dying from health conditions caused by environmental pollution. The social benefit is the economic savings due to less of the external costs of pollution being passed on to society through regulation.
Slashing exposure to air pollution from the combustion of fossil fuels would lead to longer lifespans and increased labor productivity. Anxiety would lessen and metal health could improve, potentially leading to less depression, schizophrenia and40 autism. Other economic and social benefits would ensue such as the attraction of private investment to these communities for other necessary and beneficial purposes such as housing construction and use of land for parks, both of which could reduce stress and boost health and productivity.
“In 2018 over 850,000 Californians live within 2,500’ of an active oil well and improving their mortality by decreasing their PM2.5 air pollution would provide social benefits at least $382.5 million annually,” the memo states. In actual fact, the costs to their health are even greater because they are exposed to a cocktail of other toxics in addition to fine particulate matter. Thus, the benefits would likely be even greater as exposure to them would also be cut along with PM 2.5. Doing nothing means the status quo is costing the state at least $382.5 million annually and probably a lot more.
“The state of California needs to recognize that the impacted communities are paying an enormous amount with their health and well-being so oil and gas companies can extract oil and gas for profit,” the researchers wrote, noting that 2.17 million Californians lived within 2,500 feet of new, active, and idle wells in 2020. “The impacted communities are directly subsidizing the oil and gas companies, and thereby the end users of the oil and gas extracted. The state should not continue to make the impacted communities subsidize oil and gas produced in California.”
According to the FracTracker Alliance, today nearly 2.8 million people live within 3,200 feet of an oil or gas well—the distance the state proposed last year as a41 setback. Using the yardstick of 2.8 million people living within 3,200 feet of a well, slightly more than 126 premature deaths from PM2.5 exposure would occur using the researchers’ formula, FracTracker calculates. This loss of life is societally valued at $1.2 billion annually.
A Subset Of Air Pollution Costs To EJ Communities: $1.2 billion annually for a total of $27.6 billion through 2045
Costs As Yet Uncounted And Unconfronted
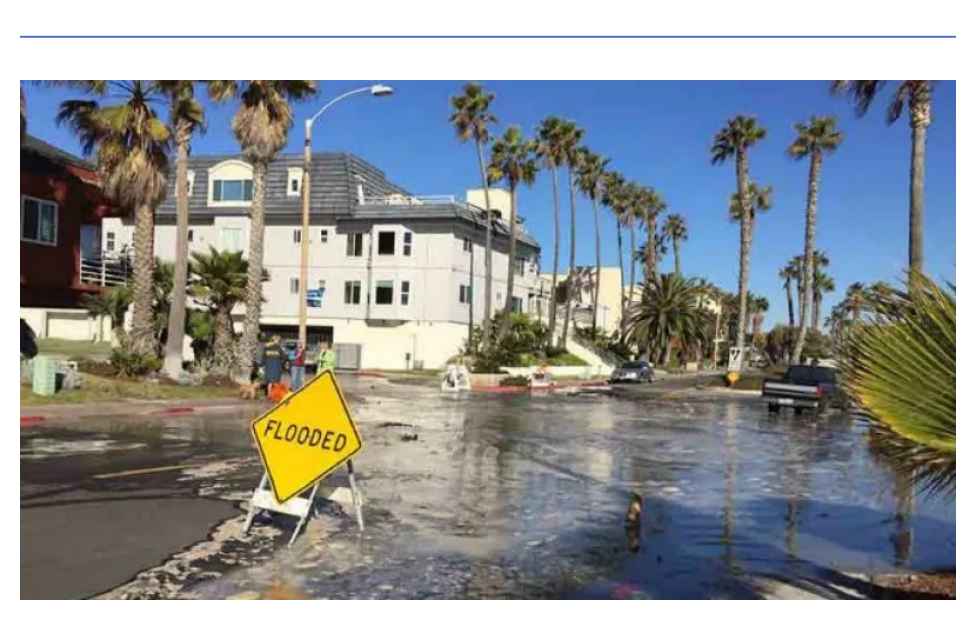
The figures estimated in this report do not take into account all the economic costs that extreme heat, more severe wildfires, more frequent and intense droughts, flooding, including coastal flooding and the erosion of two thirds of Southern California’s beaches by 2100 will inflict on the state. No aspect of daily life will remain untouched, and these costs will undoubtedly reach many more billions of dollars over time.
The Legislative Analyst’s Office (LAO) advisor to the Legislature, has released a series of reports based on existing data and projections that do not mince words. “These hazards will threaten public health, safety, and well-being — including from life-threatening events, damage to public and private property and infrastructure,42 and impaired natural resources,” the analysts write. “Certain populations— particularly lower-income, older, and medically compromised individuals, as well as outdoor workers—will disproportionately bear the adverse health burdens of climate change.”
The omens are not good. In 2021, California experienced its hottest average summer temperatures, its second largest wildfire, and its third driest year, based on precipitation, on record. There is no reason to think climate change will not continue. Among the main findings of these reports are:
- Wildfires, heat and floods with force more frequent school closures that
will disrupt education, childcare and availability of free school lunches. Between 2017 and 2020, more than 1,600 schools had to temporarily close because of wildfires every year, affecting the lives of one million students annually.
- Workers in agriculture, construction, forestry and recreation, all outdoor
industries, will continue to bear the brunt of extreme smoke and heat.
- Wildfire smoke that might have killed about 20 people among every
100,000 older Californians in 2020, is expected to become more deadly, killing between nine and more than 20 people every year.
- Between $8 and $10 billion dollars of existing property in California is
likely to be underwater by 2050, with an additional $6 billion to $10 billion at risk during high tide. Rising seas and tides threaten infrastructure from housing to rail lines, bridges, ports, power plants and freeways.
- In the San Francisco Bay Area alone, 13,000 existing housing units and
104,000 job spaces will no longer be usable because of sea level rise between 2062 and 2122.
The LAO makes no policy recommendations, and though Governor Newsom proposes to set aside $22 billion for efforts such as hardening communities against wildfires and extreme heat, so far his administration and regulators including the California Air Resources Board and the California Geologic Energy Management Division that issues drilling permits, have no comprehensive blueprint to stop all43 permitting and fully and swiftly phase out of fossil fuels. Writes CalMatters, “Despite the state’s climate-forward reputation, critics and many legislators note that California’s follow through has been inconsistent.”
“We’re plagued by ‘climate delayers’ in Sacramento —members of the Legislature who talk about climate change but don’t back up those words with action,”
“Any further delay
Mary Creasman, CEO of California Environmental44 Voters wrote in a CalMatters opinion piece.
in concerted global
“Curious about why our state is failing to take meaningful steps to address the climate crisis? Follow
action will miss a
the money.
“Corporate polluters spend millions of dollars to brief and rapidly influence the Legislature. A shocking 63% of
closing window to
California state legislators accepted direct campaign contributions from oil companies and major oil
secure a livable
industry Political Action Committees since 2018.
This includes 52% of Democrats and 96% of
future.”
Republicans.
“The influence of corporate polluters in Sacramento should infuriate us all. They have already done irreparable damage to our public health and economy. Their opposition to climate action could cost us our future. This month, the Intergovernmental Panel on Climate Change issued a report that underscores the impact climate change (opens in new tab) has on our lives. Their research makes clear (opens in new tab) that incremental attempts to mitigate the effects of climate change are not sufficient.45 The time is now for transformational, systemic change.”
Indeed, Hans-Otto Pörtner, the co-chair of the IPCC Working Group II, had this to say: “The scientific evidence is unequivocal: climate change is a threat to human46 wellbeing and the health of the planet. Any further delay in concerted global action will miss a brief and rapidly closing window to secure a livable future.”
has on our lives. Their research makes clear that incremental attempts to mitigate the effects of climate change are not sufficient. The time is now for transformational, systemic change.”45 Indeed, to say: “
Conclusion
In a 2021 report, the International Energy Agency said that the world needs to immediately stop approving new oil and gas fields, new coal-fired plants (California has virtually phased them out), and quickly phase out gasoline-powered vehicles to47 avert the most catastrophic effects of climate change. Slashing carbon dioxide emissions to net zero by 2050 will likely keep the average global temperature from increasing 1.5 degrees Celsius above preindustrial levels. Past that point, the Earth faces irreversible damage.
It is clear that the costs of fossil fuels to California in human and environmental terms are unsustainable. Environmental justice communities where oil drilling takes place and that are located near major truck routes are primary sacrifice zones. Also sacrificed is the public health throughout the state in the form of air pollution from fossil fuel combustion. The place to start a transition off of fossil fuels is right here in our own backyard. California’s economy is the largest in the U.S. boasting a three-trillion-dollar gross state product as of 2020. If California were a country, it would rank as the world’s fifth largest economy. California’s example matters. Governor Newsom’s goal for the state to be carbon neutral by 2045 will not come to pass if his Administration continues to approve oil and gas permits for new wells and to rework existing wells. The permit count has gone past 10,000 permits since he took office in January 2019, rivaling the number issued by former Governor Jerry Brown, a major oil industry supporter.
In addition, as California oil producers begin to scrape the proverbial barrel, the carbon intensity of California’s tar-like, filthy and hard-to-extract oil has been steadily increasing, eclipsing the carbon intensity of oil imported from elsewhere,48 according to a 2020 study by the CBD.
California oil made up 31% of all the oil refined in California between 2012 and 2019 but was responsible for 39% of the upstream carbon emissions, CBD found. “Thus, on average California oil emits more carbon dioxide per barrel than the rest of the global supply refined in California,” the group wrote. “So, although California oil production is declining, the increase in carbon intensity is helping to cancel out the climate benefits of declining production.”
The group studied CARB data on carbon intensity from exploration to refining for all oils refined in the state. “We found that the average carbon intensity of all oil refined in California is increasing, but the average carbon intensity of just the oil produced in California is increasing far faster,” the group wrote. “The carbon intensity of California-sourced oil is growing at twice the rate of all oils refined in California, and nearly three times the rate of oil produced outside of California. By 2019, the average carbon intensity of California-sourced crudes was more than one-and-a-half times greater than that of crudes produced outside of California.” The latest analysis on permitting by the FracTracker Alliance found that in October 2021, drilling permits by CalGEM, significantly decreased for new oil and gas production drilling permits and for drilling “enhanced oil recovery wells” that49 use harsh steaming and other methods to extract oil. This timeline corresponds to a California Court decision to deny Kern County, the heart of California’s oil drilling, the authority to issue new drilling permits and thus suggests a possible
backlog at CalGEM, according to the group. But the issuing of permits for more wastewater injection wells, gas storage wells, and to rework, re-drill or deepen existing production and EOR wells continues, FracTracker reports.
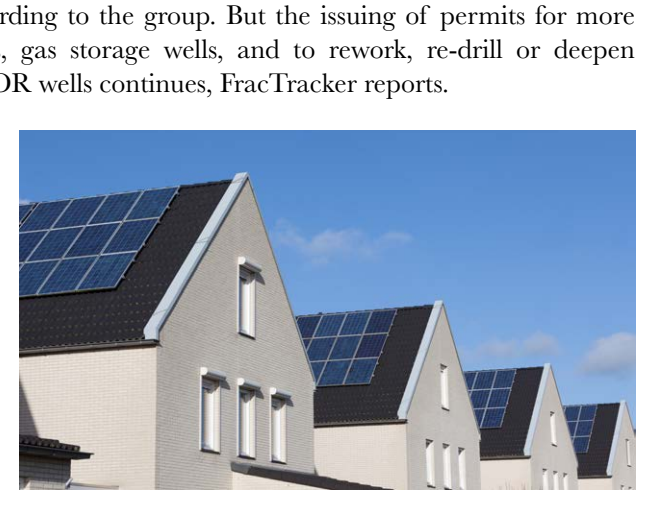
All this must cease. Oil and gas workers must be put to work plugging wells, decommissioning infrastructure, and must be given major state support, not token sums, to transition to other economic sectors. New forms of clean power generation—including decentralized forms such as rooftop solar that can insulate against power outages—transportation and vehicle charging infrastructure must be incentivized and adopted as fast as possible. Tardiness invites irreversible destruction. Meanwhile, the costs of fossil fuels on California are only going in one direction—up.
Citations
See the Understanding Global Change Project at the University of California Museum of Paleontology at UC Berkeley: https://ugc.berkeley.edu/background-content/burning-of-fossil-fuels/ (opens in new tab)2 For more on EPA emissions estimates, see: https://www.epa.gov/ghgemissions/ global-greenhouse-gas-emissions-data (opens in new tab)3 For charts on U.S. states’ greenhouse gas emissions, see: https://www.wri.org/ insights/8-charts-understand-us-state-greenhouse-gas-emissions (opens in new tab)4 See CARB pie chart on page 8: ( https://ww3.arb.ca.gov/cc/inventory/pubs/ reports/2000_2019/ghg_inventory_trends_00-19.pdf (opens in new tab)5 For a ranking of contributors by country of GHGs, see: https:// climatetrade.com/which-countries-are-the-worlds-biggest-carbon-polluters/ (opens in new tab)6 For a list of wildfires through 2021, see: https://en.wikipedia.org/wiki/ List_of_California_wildfires (opens in new tab)7 For more on wildfire intensity, see: https://www.washingtonpost.com/weather/ 2022/02/16/fire-intensity-night-study/ (opens in new tab)8 See: https://newsroom.ucla.edu/releases/frequent-wildfires-human-caused-climate-change (opens in new tab) and https://www.latimes.com/california/story/2021-11-01/ climate-change-is-now-main-driver-of-wildfire-weather (opens in new tab)9 Consumer Watchdog arrived at its fossil fuel cost allocation for wildfires and drought by multiplying.78 (for 78% of GHGs coming from fossil fuels since 1970) by the percentage of costs that scientists allocate to human activity leading to climate change exacerbating wildfires and drought.10 For the study on worsening drought and its human causes, see: https:// www.nature.com/articles/s41558-022-01290-z.epdf (opens in new tab)11 See: https://calclimateag.org/the-economic-impacts-of-the-climate-crisis/ (opens in new tab)12 For a chart breaking down disasters by category, see: https:// www.ncdc.noaa.gov/billions/summary-stats/CA/2011-2021 (opens in new tab) For the federal report on sea level rise from global warming, see: https:// www.latimes.com/california/story/2022-02-16/rising-sea-levels-pose-perilous-threat-to-california-coast-study-raises-new-alarms (opens in new tab)14 For more on the true costs of wildfires, see: https://www.nfpa.org/News-and-Research/Publications-and-media/NFPA- Journal/2020/November-December-2020/Features/Wildfire (opens in new tab)15 For an explanation of direct and indirect wildfire costs, see: https:// www.westernforesters.org/blog/wildfire-west-what-does-it-really-cost (opens in new tab)16 See the CCST report on the cost of wildfire in California here: https://ccst.us/ wp-content/uploads/The-Costs-of-Wildfire-in-California-EXECUTIVE- SUMMARY.pdf (opens in new tab) And https://calmatters.org/economy/2021/10/california-wildfires-economic-impact/ (opens in new tab)17 For Accuweather estimates for 2017, 2018 and 2019, see: https:// www.accuweather.com/en/weather-news/california-wildfires-will-cost-tens-of- billions-accuweather-estimates/612548 (opens in new tab) For more detail on Accuweather’s tally of 2018 California wildfire costs, see: https://www.accuweather.com/en/weather-news/accuweather-predicts-2018- wildfires-will-cost-california-total-economic-losses-of-400-billion-2/432732 (opens in new tab) And https://en.wikipedia.org/wiki/2018_California_wildfires#cite_note-3018 For Accuweather estimates for 2017, 2018 and 2019, see: https:// www.accuweather.com/en/weather-news/california-wildfires-will-cost-tens-of- billions-accuweather-estimates/612548 (opens in new tab)19 For more on Accuweather’s 2020 wildfire estimates, see: https:// www.accuweather.com/en/severe-weather/wildfires-in-western-us-could-cause-130-billion-to-150-billion-in-losses/812654 (opens in new tab)20 For Accuweather 2021 fire season estimates, see: https://www.accuweather.com/ en/severe-weather/2021-wildfire-season-economic-damages-estimate-70-billion-to-90-billion/1024414 (opens in new tab)21 For more on heat-related deaths from climate change, see: https:// www.epa.gov/climate-indicators/climate-change-indicators-heat-related-deaths (opens in new tab)22 For the CBD analysis and citation of the underlying academic study, see: https://biologicaldiversity.org/w/news/press-releases/new-analysis-gov-newsom-urgently-needs-to-stop-permitting-new-oil-gas-wells-in-california-2021-11-01/ (opens in new tab)
16 https://ccst.us/ wp-content/uploads/The-Costs-of-Wildfire-in-California-EXECUTIVE- SUMMARY.pdf And
For more on the social cost of carbon, see: https://theconversation.com/what- is-the-social-cost-of-carbon-2-energy-experts-explain-after-court-ruling-blocks-bidens-changes-176255 (opens in new tab)24 A Trump-appointed judge has currently blocked that Biden interim price increase. Biden’s proposed—and interim —social cost of carbon is $51 dollars per metric ton of carbon dioxide, roughly what the Obama Administration used and many times higher than the slashed amount Trump used of between $1 and $7 per ton. See: https://theconversation.com/what-is-the-social-cost-of-carbon-2-energy-experts-explain-after-court-ruling-blocks-bidens-changes-176255 (opens in new tab)25 For more about the mortality cost of carbon and the social cost of carbon that is increased when the mortality cost is included, see: https://www.vox.com/future-perfect/22643358/social-cost-of-carbon-mortality-biden-discounting (opens in new tab)26 For more on the VSL, see: https://www.ncbi.nlm.nih.gov/pmc/articles/ PMC7499700/ (opens in new tab)27 For Bressler’s paper, see: https://www.nature.com/articles/s41467-021-24487-w (opens in new tab)28 For more on the health effects of burning fossil fuels, see: https:// www.law.nyu.edu/centers/state-impact/projects-reports/projects/climate-and-health/health-effects-of-burning-fossil-fuels (opens in new tab)29 For more on the State of the Air 2021 report, see: For the State of the Air 2021 report, see: https://www.lung.org/research/sota/key-findings (opens in new tab)30 For more on the State of the Air 2022 report, see: https://www.lung.org/research/sota/key-findings (opens in new tab) And https://www.cnn.com/ 2022/04/21/health/air-pollution-report/index.html (opens in new tab)31 For more on 2022 CA counties and pollution rankings see: https:// www.lung.org/research/sota/city-rankings/states/california (opens in new tab)32 For America’s Health Rankings, see: https://www.americashealthrankings.org/ explore/annual/measure/air/state/CA (opens in new tab)33 See: https://www.psr-la.org/issues/air-pollution-and-goods-movement/ (opens in new tab)34 For the Fullerton study, see: http://calstate.fullerton.edu/news/2008/091-air-pollution-study.html (opens in new tab)
Biden’s proposed—and interim —social cost of carbon is $51 dollars per metric ton of carbon dioxide, roughly what the Obama Administration used and many times higher than the slashed amount Trump used of between $1 and $7 per ton
For IQAir, see: https://www.iqair.com/blog/air-quality/the-cost-of-air-pollution- in-2020 (opens in new tab)36 For more on CARB estimates of economic benefits of air pollution regulation, see: https://ww3.arb.ca.gov/board/books/2018/020818/18-1-2pres.pdf (opens in new tab) Also see: https://consumerwatchdog.org/sites/default/files/2022-01/ Overview%20Health%20Benefits%20of%20CARB%20Programs.pdf (opens in new tab)37 For the air pollution study of PM2.5 and ozone emissions in California, see: https://www.sciencedirect.com/science/article/pii/S016041201932447X (opens in new tab)38 After the memo’s submission, CalGEM issued a draft rule in October last year to set a distance of 3,200 feet between communities where people live, work, and play. The rule bans new drilling within that distance, but not the reworking of wells to assure continued production. For the memo, see: https://docs.google.com/ document/d/1T5AtLdlNZZUrUP2HgTAiUvlpJEqTCQ7YxeDQCQZThDE/ edit (opens in new tab)39 The value of a statistical life is an estimate of the amount of money that the public is willing to spend to protect a life. It is used to estimate whether a new regulation’s benefits outweigh its costs. Over time, wages have risen and the amount the public is willing to spend for safety measures have grown, thus agencies have dramatically increased what they think a life is worth, according to Bloomberg.com. See: https://www.bloomberg.com/graphics/2017-value-of-life/ (opens in new tab)40 For more on the psychological, economic and social costs of air pollution, see: https://mitsloan.mit.edu/ideas-made-to-matter/psychological-economic-and-social-costs-air-pollution (opens in new tab)41 For the FracTracker overview of the implications of a 3,200 foot setback, see: https://www.fractracker.org/a5ej20sjfwe/wp-content/uploads/2021/12/ Setback3200Summary_FracTracker_12.21.21_nomaps.pdf (opens in new tab)42 For the LAO reports, see: https://lao.ca.gov/Publications/Series/1 (opens in new tab) And https://calmatters.org/environment/2022/04/california-climate-change-report-legislature/ (opens in new tab) For a letter from advocacy groups critical of the California Air Resources Board’s approach in developing the 2022 Climate Change Scoping plan to guide the next 20 years of climate action, see: https://caleja.org/wp-content/uploads/2022/03/ Letter-to-CARB-EJ-Recommendations-for-2022-Scoping- Plan-03-09-22_revised-2-1.pdf (opens in new tab)44 For the Creasman piece, see: https://calmatters.org/commentary/2022/03/ california-gets-a-grade-of-d-for-inaction-on-the-climate-crisis/ (opens in new tab)45 For the IPCC Sixth Assessment Report, see: https://www.ipcc.ch/report/ar6/ wg2/ (opens in new tab)46 For the IPCC press statement about the report, see: https://www.ipcc.ch/ report/ar6/wg2/downloads/press/IPCC_AR6_WGII_PressRelease-English.pdf (opens in new tab)47 For the IEA report, see: https://www.theguardian.com/environment/2021/ may/18/no-new-investment-in-fossil-fuels-demands-top-energy-economist (opens in new tab)48 For the CBD report, see: https://www.biologicaldiversity.org/programs/ climate_law_institute/pdfs/June-2021-Killer-Crude-Rpt.pdf (opens in new tab)49 For the FracTracker permitting analysis, see: https://www.fractracker.org/ 2022/03/new-trends-in-drilling-permit-approvals-take-shape-in-ca/ (opens in new tab)