

Consumer Watchdog Introduction: $5 Diesel Fuel Is Killing the U.S. Economy;
How Oil Companies Shorted the Market and Made It Happen Diesel fuel is the engine of American commerce and public life. Oil companies, by manipulating supply, put sugar in the tank of a whole economy this spring. The companies and their refiners produced less diesel, imported less diesel and exported far more diesel than in previous years. This shortage was abetted by a careless and deliberate lack of oversight by government. The story is laid out step by step in this study by independent analyst Tim Hamilton. Gasoline prices are wrecking family budgets, driving inflation and even affecting the housing market, as workers abandon commutes from distant suburbs. Yet consumers’ pockets are also picked by diesel fuel costs that soared to more than $5.00 a gallon in some markets, far above the cost of gasoline. (See Chart 1 (opens in new tab) below.) While the general increase in fuel prices was in large part due to the price of oil, diesel’s rise above the price of gasoline was due to oil companies’ actions and government’s refusal to oversee or regulate a critical industry.
Farm prices, grocery costs, the prices of manufactured goods, clothing and even fast food are driven by the cost of diesel fuel. The nation’s trucks, trains, ports, farm vehicles and construction equipment run almost entirely on diesel. Its cost effects on the economy will be long-lasting. School districts, police departments and fire departments face the choice between tax increases and service cutbacks due to diesel prices.
Transit and manufacturing companies are also increasing their fuel surcharges at record rates. For instance:
- Dow Chemical, which recently announced a 20% increase in its product prices, is also imposing a $300 surcharge on North American truck deliveries, and $600 on rail deliveries.
- UPS has raised its fuel surcharges, which will now range from 9.5% for domestic ground deliveries to 32.4% for air shipment.
- Independent truckers are adding surcharges of 70 cents to 80 cents per gallon of fuel used on each trip, on trucks that get about 6 miles to the gallon. This surcharge shows up in consumer goods, right down to paper napkins at the burger joint. Diesel is a part of the sharp increase in building construction costs, for fuel on-site and for delivery of truckloads of building materials. Much of the increased price of groceries is for transportation to the store, and for diesel used on the farm.
Oil companies have blamed blame rising world demand for diesel and the cost and difficulty of making cleaner low-sulfur diesel. This study shows how oil companies told a different story only few years ago.
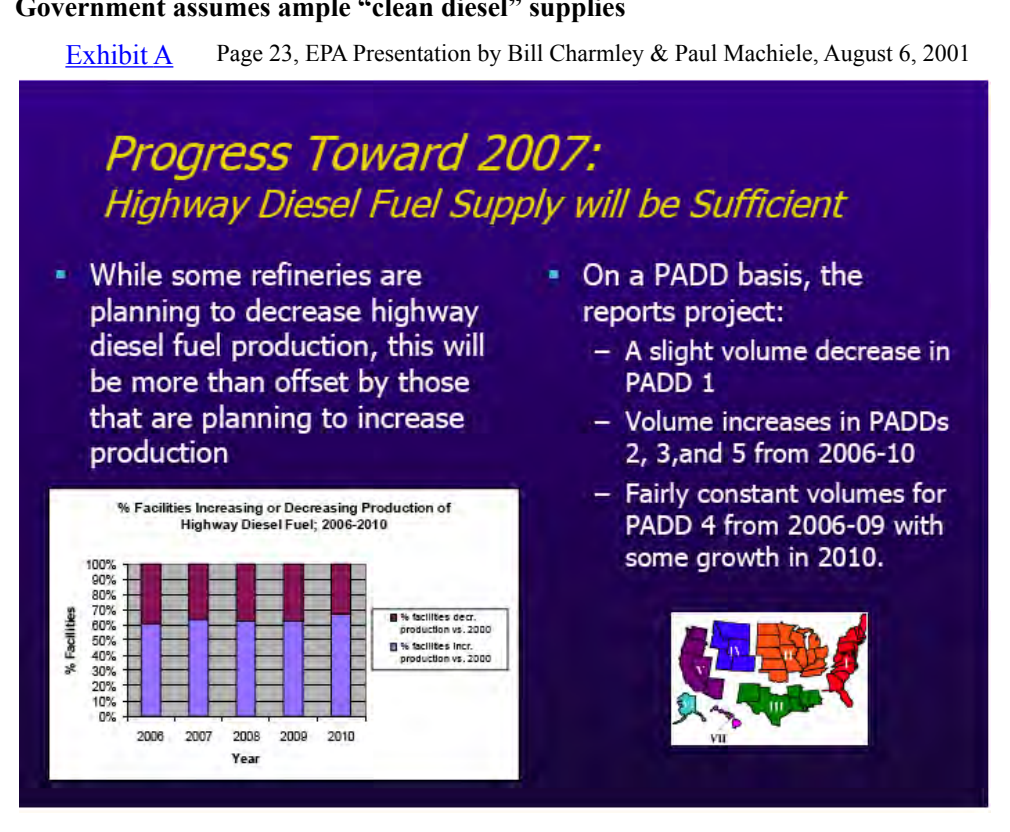
The companies assured government that they would update their refineries to produce ample supplies of the clean diesel in time for the 2006 switchover (see Exhibit A (opens in new tab)). They didn’t achieve that promise. Instead, they shorted the market by reducing production (See Table 1 (opens in new tab), Chart 2 (opens in new tab) and Chart 3) (opens in new tab) and drove up the price. They also failed to import sufficient diesel when supplies ran low ( See Chart 4 (opens in new tab)), and at the same time they sharply increased their exports of diesel fuel ( Chart 5 (opens in new tab)), taking advantage of high world prices, to the detriment of U.S. consumers.
The result? The cost of gasoline is up about $1.00 a gallon from a year ago, and diesel spiked by up Page 2 to $2.00 in a year. Hamilton shows why this is due to the deliberate actions and inactions of the major oil companies, seeking additional profit at the cost of consumers and the economy. Judy Dugan Research Director Consumer Watchdog
EXECUTIVE SUMMARY By Tim Hamilton The chief findings of this report include:
- Because diesel and gasoline are produced from the same barrel of oil, the widely publicized increase in the price of crude oil is not the reason that the retail price of diesel, which historically tracked 5 cents to 10 cents per gallon below regular gasoline, increased to 37.3 cents over regular in the first quarter of 2008; (Chart 1)
- The dramatic draw-down in distillate stocks (diesel inventories) in the spring of 2008 was a driving factor in diesel climbing from the bottom to the top of the price ladder; (Table 1)
- Government regulators overseeing the transformation to ultra low sulfur diesel in the US from 2000-2007 believed the oil industry’s assurances that it would provide adequate refining capacity. They were incorrect and as a result refining bottlenecks spiked prices for consumers and profits for the companies;
- In the spring of 2008, the oil companies further curtailed production of diesel in US refineries, cut back imports, and increased exports which resulted in the drawdown of distillate inventories and increased prices as well as corporate profits; and
- Unlike the typical motorist, who can cut back on discretionary driving, the commercial user
of diesel could not easily cut consumption without dramatic layoffs or business cutbacks, so diesel price increases exceeded those for gasoline.
Background:
Motorists in the U.S. and Canada rely on gasoline as their primarily motor fuel. Vehicles used in commercial activities such as fishing, farming, logging, freight transporation, and buses or other public transportation are the primary consumers of distillate or diesel as its commonly known. Diesel has historically been the lowest-priced motor fuel in the United States. Yet over the last several years, diesel prices have often spiked well above gasoline, reaching $5 per gallon in California in the spring of 2008.
While the price of gasoline affects the disposable income of the general population, it is the Page 3 price of diesel that most dramatically affects the costs of goods and services, driving inflation nationwide and dragging down the economy. During the past three years, small businesses, farmers, and other commercial interests have suffered due to an inability to pass on all the increased costs of diesel.. The rise in diesel is also creating a funding crisis for many public agencies that are forced to choose between raising taxes and cutting services. In the state of Washington, as an example, the increased cost of diesel for school buses is the equivalent of the loss of 1,000 new school teachers.
By the spring of 2008, the impact of diesel prices had spread far from the pump islands as escalating prices of groceries and other consumer goods joined forces with the high gasoline pump prices as a cause of consumers’ and economists’ concern.
On behalf of Consumer Watchdog, I examined industry and public data — including data compiled by public school systems, the federal Energy Information Administration, US Department of Agriculture and other publicly available sources—to find the causes and effects of diesel prices that far outpaced those occuring for gasoline.
PART 1: The price of diesel is the “big stick” threat to the economy
When the price of motor fuel escalates, the public’s attention is typically focused by the media on the pump price of gasoline. While the impact of high gasoline prices on American motorists is significant, the effects of skyrocketing diesel prices are often missed in the public debate. An increase in diesel prices can send shock waves throughout the economy as the “pain at the diesel pump” inevitably moves to the cash register at grocery stores and growing lines at the unemployment office. Impacts on state and local government can require the public to make the choice between a significant increases in taxes or a corresponding reduction in services. As an example, a penny per gallon increase in the price of diesel costs public schools in Washing-1 ton State approximately $100,000 annually to fuel school buses. This penny is the equivalent of three2 new entry level teachers earning $32, 746 under the state’s teacher salary schedule. The $3.35 per3 gallon increase in the average diesel price in Washington from the average $1.34 in 2004 to $4.69 by2 June of this year will ultimately equal the funding 1,000 new teachers. As a result of the price increase, many schools are cutting back school transportation by dropping athletics or other nonessential activities. Some are even going so far as to only provide buses 4 days per week.
Like public schools, local governments across the nation are struggling to pay for increased cost of diesel for transit buses, ambulances, fire trucks and other emergency service vehicles. Battle Creek, MI,4 saw its transportation fuel bill triple from $450,000 in 2004 to a projected $1.4 million in 2009. It and other municipalities are looking at layoffs or reduction in services for police, fire, and nearly every form of government services.
Historically, diesel was the cheapest motor fuel in the United States. The lowest price on the sign at gas stations or truck stops, diesel commonly sold for 5 cents to10 cents below regular gasoline. If oil companies simply passed on increases in oil prices, one could expect to see a higher price, but the difference between gasoline and diesel would remain relatively the same as prior years.1 WA Office of Superintendent of Public Instruction, Division of Pupil Transportation2 WA Office of Superintendent of Public Instruction www.k12.wa.us/SAFS/PUB/PER/SalAllocSchedule.pdf3 Energy Information Administration (EIA) http://tonto.eia.doe.gov/dnav/pet/pet_pri_gnd_dcus_nus_w.htm4 Battlecreek Inquirer, June 18, 2008 Page 4 Even though gasoline and diesel are both refined from the same barrel of oil, the oil companies and their refiners have raised the price of diesel relative to gasoline significantly in the last three years. The average price of diesel in the U.S. during the first quarter soared from 14 cents below regular in 2004 to 28 cents over in 2008 (Chart 1).
Tracking the difference between the retail price of diesel and
Chart 1
regular gasoline in the US during the first quarter 2000-2008
Gasoline “base line” 1st-1st-1st-1st-1st-1st-1st-1st-1st- 000102030405060708 -8.3-7.3-6.8-9.6-14.4-1.7-1.14.114.3 Diesel difference in ¢pg The second quarter of this year will prove even more dramatic as the average price of on-road5 diesel in the U.S at the pump soared to $4.73 on May 26, 2008 increasing the differential to 79.4 cents per gallon. Clearly, this growing differential documents an increase in diesel prices that far exceeds the four cent increase in refining costs for ULSD that government regulators anticipated would be passed on at the pump.
When prices of gasoline reach record levels, motorists have the option of cutting back on discretionary driving. Diesel users simply can’t respond in this manner as very little discretionary driving is found among commercial users. To cut consumption, the logger has to decide not haul the logs, fisher-men have to decide to leave boats tied up to the dock. The farmer is forced to decide whether or not to plant. He faces the risk of having to let the crop rot in the field due to an inability to pay for the diesel5 Energy Information Administration (EIA) http://tonto.eia.doe.gov/dnav/pet/pet_pri_gnd_dcus_nus_w.htm Page 5
| 1st- 00 | 1st- 01 | 1st- 02 | 1st- 03 | 1st- 04 | 1st- 05 | 1st- 06 | 1st- 07 | 1st- 08 | |
| Diesel difference in ¢pg | -8.3 | -7.3 | -6.8 | -9.6 | -14.4 | -1.7 | -1.1 | 4.1 | 14.3 |
needed to harvest.
It is therefore critical that the supply of diesel not be set “short” by the oil industry, especially in early spring when farm planting starts and other commercial activity increases demand. If diesel is short, the price will rise for both gas and diesel. As consumption slows down for gasoline in response, diesel keeps rising as commercial users are forced to continue normal purchasing. Only a full-blown recession is likely to significantly reduce diesel usage.
Table 1 In the spring of 2008, diesel users were struck by a near “worst case scenario” (Table 1). The oil companies reduced distillate stocks (inventories of diesel and fuel oil) by 561 million gallons compared to 2006, placing the U.S. on the verge of running out of diesel. The price of diesel kept increasing and was a major factor in the increase of so-called “non-core” inflation. By June the public concern over the nation’s economy set the headlines of the day as diesel topped $5 per gallon in California.
Part 2: Oil companies’ failure to maintain adequate refining capacity for low-sulfur “clean diesel” set the stage for diesel’s price spike
In 2001, the US Environmental Protection Agency (EPA) adopted rules that would require diesel6 sold for on-road consumption to have a maximum of 15 parts per million of sulfur by June of 2006 . The environmental and health benefits were expected to save the economy $70 billion each year at the cost of approximately $4 billion by annually eliminating 2.6 million tons of particulates and smog-forming oxides of nitrogen. Expected benefits included prevention of:
- 8,300 premature deaths,
- 5,500 cases of chronic bronchitis;
- 360,000 cases of respiratory symptoms in
- 1.5 million lost work days;
- 7,100 hospital visits; and
- 2,400 emergency room visits for asthma.
The refiners were given a phase-in schedule until 2006 to retrofit refineries in the U.S. to produce the new ultra low sulfur diesel (ULSD). The EPA originally predicted ULSD to cost approximately 4 cents per gallon more than the higher sulfur diesels of the past. Unfortunately, just as in the case a decade earlier when sulfur was reduced in gasoline, the enabling legislation and regulations did not include legal requirements that the oil companies increase or even maintain their historical level of refining capacity in the U.S.
As a result, even though the oil companies repeatedly assured regulators that they would have adequate clean-diesel refining capacity, (Exhibit A), the end result was that refining capacity in the U.S. today barely meets the nation’s needs for diesel. This set the stage for diesel prices to spike when an increase in demand or a decrease in production resulted in a draw-down of inventories.6 EPA, Office of Transportation and Air Quality, Program Update, EPA 420-F-06-064, October 2006 Page 6
| Entire US | Mar-06 | Mar-07 | Mar-08 |
|---|---|---|---|
| Ending Distillate Stocks (gallons) | 5,062,848,000 | 5,025,342,000 | 4,501,770,000 |
| Drop In Stocks From 2006 | N/A | 37,506,000 | 561,078,000 |
| Average Pump Price | $ 2.565 | $ 2.676 | $ 3.964 |
Government assumes ample “clean diesel” supplies
Page 23, EPA Presentation by Bill Charmley & Paul Machiele, August 6, 2001 Exhibit A Progress Toward 2007: Highway Diesel Fuel Supply will be Sufficient the
- Whille some refineries are • On a PADD basis,
planning to decrease highway reports project: diesel fuel production, this will -A slight volume decrease in be more than offset by those PADD 11 that are planning to increase -Volume increases in PADDs production 2, 3,and 5 from 2006-10 PADD 4 from 2006-09 with some growth in 2010.
“■—-■ ,,■—-■ l’!i,:;t;,,;:lllt’ie:s:de:,cr.
111111111111
■—-■ ■—-■ ■—-■
Part 3: The factors that caught the U.S. short on diesel this spring
Provided the individual energy companies do not illegally and deliberately collude, each is free to: a) increase or decrease the production in its refineries (refinery utilization); b) export at will to foreign destinations, and c) import, or not, from refineries elsewhere in the world. While predictable and well known to the industry, demand is the remaining factor that determines the differential between the costs of crude oil and the price at the pump. It is also the only factor not directly or indirectly controlled by the industry.
With decontrol of the oil industry during the Reagan Administration in the early 80’s, the oil industry was allowed to set the level of inventories for refined product without government oversight. Absent collusion, the companies can set or time maintenance and production volumes at U.S. refineries to maximize profit margins. They are free to export or import diesel and other refined products in a manner that draws down inventory levels, which encourage the price spikes that have become common since 2005. While these deliberate decisions can cause prices to spike and increase the profit margins of Page 7 the companies, such behavior is not illegal or regulated under existing federal or state laws. Unless impacted by a mechanical problem or a shortage of available crude oil, the operator of a refinery in the U.S. will decide how much of the refining capacity to utilize by simply increasing or decreasing the volume of crude oil processed. The less crude in, generally the less gasoline and diesel coming out.
In the first quarter of 2008, oil companies only used 84.7% of the crude processing capacity at US refineries (Chart 2). Utilization was down significantly compared to previous years without noticeable interference by unexpected maintenance or other mechanical problems. The companies appeared to simply exercise their discretion and reduce production of gasoline and diesel.
US refinery utilization rate during the first quarter
Chart 2
from 2000-2008
92.0% 90.0% 88.0% c86.0% n84.0% 82.0% 80.0% 200020012002200320042005200620072008 US87.3%90.0%87.4%88.4%88.8%90.9%86.4%86.6%84.7% In the West, where diesel first broke the $5 daily average pump price threshold (in California), the reduction of diesel production intensified going into the second quarter (Chart 3). Compared to the previous year, diesel production from PADD V refineries dropped by up to 87,000 barrels per day from the previous year. This decision by the companies was the equivalent of taking a modern refinery off line entirely.
Page 8
2000 2001 2002 2003 2004 2005 2006 2007 2008 US 87.3% 90.0% 87.4% 88.4% 88.8% 90.9% 86.4% 86.6% 84.7%
Chart 3
Comparing the weekly production of distillate in the West during the 2nd quarter in 2007 and 2008
Average pump price of diesel in the West peaks at $4.89 ona May 26, 2008o
- ~ I I I I I I I I I I Data Source: US Energy Information Administration (EIA) A reduction in the level of imports of diesel into the U.S. also assisted in the reduction of diesel inventories (Chart 4). During the first quarter of 2008, the companies cut back average monthly imports of distillates from 11.8 million barrels to 7.9 million barrels. Out West, where diesel inventories were already down to the bottom of the storage tanks at truck loading terminals, the companies cut imports from 1.4 million barrels in the previous year to 152,000 barrels in 2008.
Imports of distillate (diesel) in the first quarter 2008 decline significantly
Chart 412,000 Monthly average for the quarter in thousands of barrels Source: EIA Page 9
Chart 3 Comparing the weekly production of distillate in the West during the 2nd quarter in 2007 and 2008 yad rep slerrab Average pump price fo of diesel in the West sdnasuohT peaks at $4.89 on May 26, 2008 6-Apr 13-Apr 20-Apr 27-Apr 4-May 11-May 18-May 25-May 1-Jun 8-Jun 2008 555 540 489 528 473 571 528 520 563 583 2007 536 517 576 510 585 594 571 563 574 517 •~ I I I I I I I I I I Data Source: US Energy Information Administration (EIA) Chart 3 Comparing the weekly production of distillate in the West during the 2nd quarter in 2007 and 2008 yad rep slerrab Average pump price fo of diesel in the West sdnasuohT peaks at $4.89 on May 26, 2008 6-Apr 13-Apr 20-Apr 27-Apr 4-May 11-May 18-May 25-May 1-Jun 8-Jun 2008 555 540 489 528 473 571 528 520 563 583 2007 536 517 576 510 585 594 571 563 574 517 •~ I I I I I I I I I I Data Source: US Energy Information Administration (EIA) Chart 3 Comparing the weekly production of distillate in the West during the 2nd quarter in 2007 and 2008 yad rep slerrab Average pump price fo of diesel in the West sdnasuohT peaks at $4.89 on May 26, 2008 6-Apr 13-Apr 20-Apr 27-Apr 4-May 11-May 18-May 25-May 1-Jun 8-Jun 2008 555 540 489 528 473 571 528 520 563 583 2007 536 517 576 510 585 594 571 563 574 517 •~ I I I I I I I I I I Data Source: US Energy Information Administration (EIA)
| 6-Apr | 13-Apr | 20-Apr 27-Ap | r 4-May 11-M | ay 18-May | 25-May | 1-Jun | 8-Jun | |
|---|---|---|---|---|---|---|---|---|
| 2008 | 555 | 540 | 489 528 | 473 571 | 528 | 520 | 563 | 583 |
| ~2 007 | I 536 | I 517 | I 576 I 510 | I 585 I 594 | I 571 | I 563 | I 574 | I 517 |
| 1st qtr 06 | 1st qtr 07 | 1st qtr 08 | |
|---|---|---|---|
| West | 545 | 1,421 | 152 |
| Other | 11,791 | 9,050 | 7,910 |
Perhaps the most startling statistic comes from EIA export data. While production in US refineries was reduced and the companies imported fewer barrels of refined product from refineries abroad, exports of distillate from US harbors to foreign destinations increased significantly. Compared to the previous year, the companies jumped exports from all ports from 6.2 million barrels to just over 11 million barrels (Chart 5). In the diesel-starved West, exports jumped from 415,000 barrels to over 2.5 million barrels.
Chart 5
1st quarter exports of distillate (diesel) increase significantly in 2008
12,000 10,000 8,000 6,000 4,000 ——————————————————7——— 2,000 1st qtr 1st qtr 1st qtr 1st qtr 1st qtr 1st qtr 1st qtr 1st qtr 1st qtr 000102030405060708 4,626 2,186 4,433 4,127 2,605 3,170 3,967 6,201 11,058 US West 1,351 1,422 1,177 1,312 826 616 824 415 2,523 Monthly average exports of distillate in thousands of barrels Source: EIA The increased exporting by the oil companies amounted to the “third leg of the stool” that drew down inventories in the spring of 2008. Compared to 2005 levels, approximately 561 million gallons of diesel were missing, which impacted the pump price dramatically.
Since the companies that utilized the “three legs” benefited from increased profit margins as a result of the price increase over gasoline at the pump, a financial incentive exists for the companies to continue to manage inventories so U.S. diesel remains “short” each spring. Page 10
| ——————————————————7—– —- | |||||||||
|---|---|---|---|---|---|---|---|---|---|
| 1st qtr 1st qtr 1st qtr 1st qtr 1st qtr 1st qtr 1st qtr 1st qtr 00 01 02 03 04 05 06 07 | 1st qtr 08 | ||||||||
| – US | 4,626 | 2,186 | 4,433 | 4,127 | 2,605 | 3,170 | 3,967 | 6,201 | 11,058 |
| – West | 1,351 | 1,422 | 1,177 | 1,312 | 826 | 616 | 824 | 415 | 2,523 |